 20Hecto
Why does a bowl of organic steel-cut oats leave you feeling lethargic an hour later while your colleague stays energized? This discrepancy highlights the complexity of the nutritional correlation with blood sugar; it proves that "healthy" is a relative term defined by your unique biology. You've likely felt the frustration of following generic dietary advice only to experience unexpected glucose spikes or mid-afternoon energy crashes. Manually calculating the glycaemic load of a complex meal is tedious, and broad nutritional labels often fail to account for how your body processes specific macronutrient combinations.
We agree that your metabolic health deserves more than guesswork. This guide unlocks the science of how specific nutrients dictate your individual glucose response. You'll learn to map your personal metabolic data using modern tools to achieve peak performance and stabilized energy. We provide a clear framework for correlating meals with glucose, moving from manual logging frustration to data-driven efficiency. This analysis will help you transform raw nutritional data into a personalized roadmap for long-term wellness.
Key Takeaways
- Identify why individual biological factors cause unique glucose responses to the same foods.
- Analyze the nutritional correlation with blood sugar by understanding how proteins and fats modulate carbohydrate absorption.
- Differentiate between Glycaemic Index and Glycaemic Load to better predict the metabolic impact of complex meals.
- Replace high-friction manual tracking with visual AI logging for more precise and efficient ingredient identification.
- Access real-time meal correlation feedback to transform raw data into actionable insights for metabolic stability.
The Biology of Postprandial Glucose: Why Responses Vary
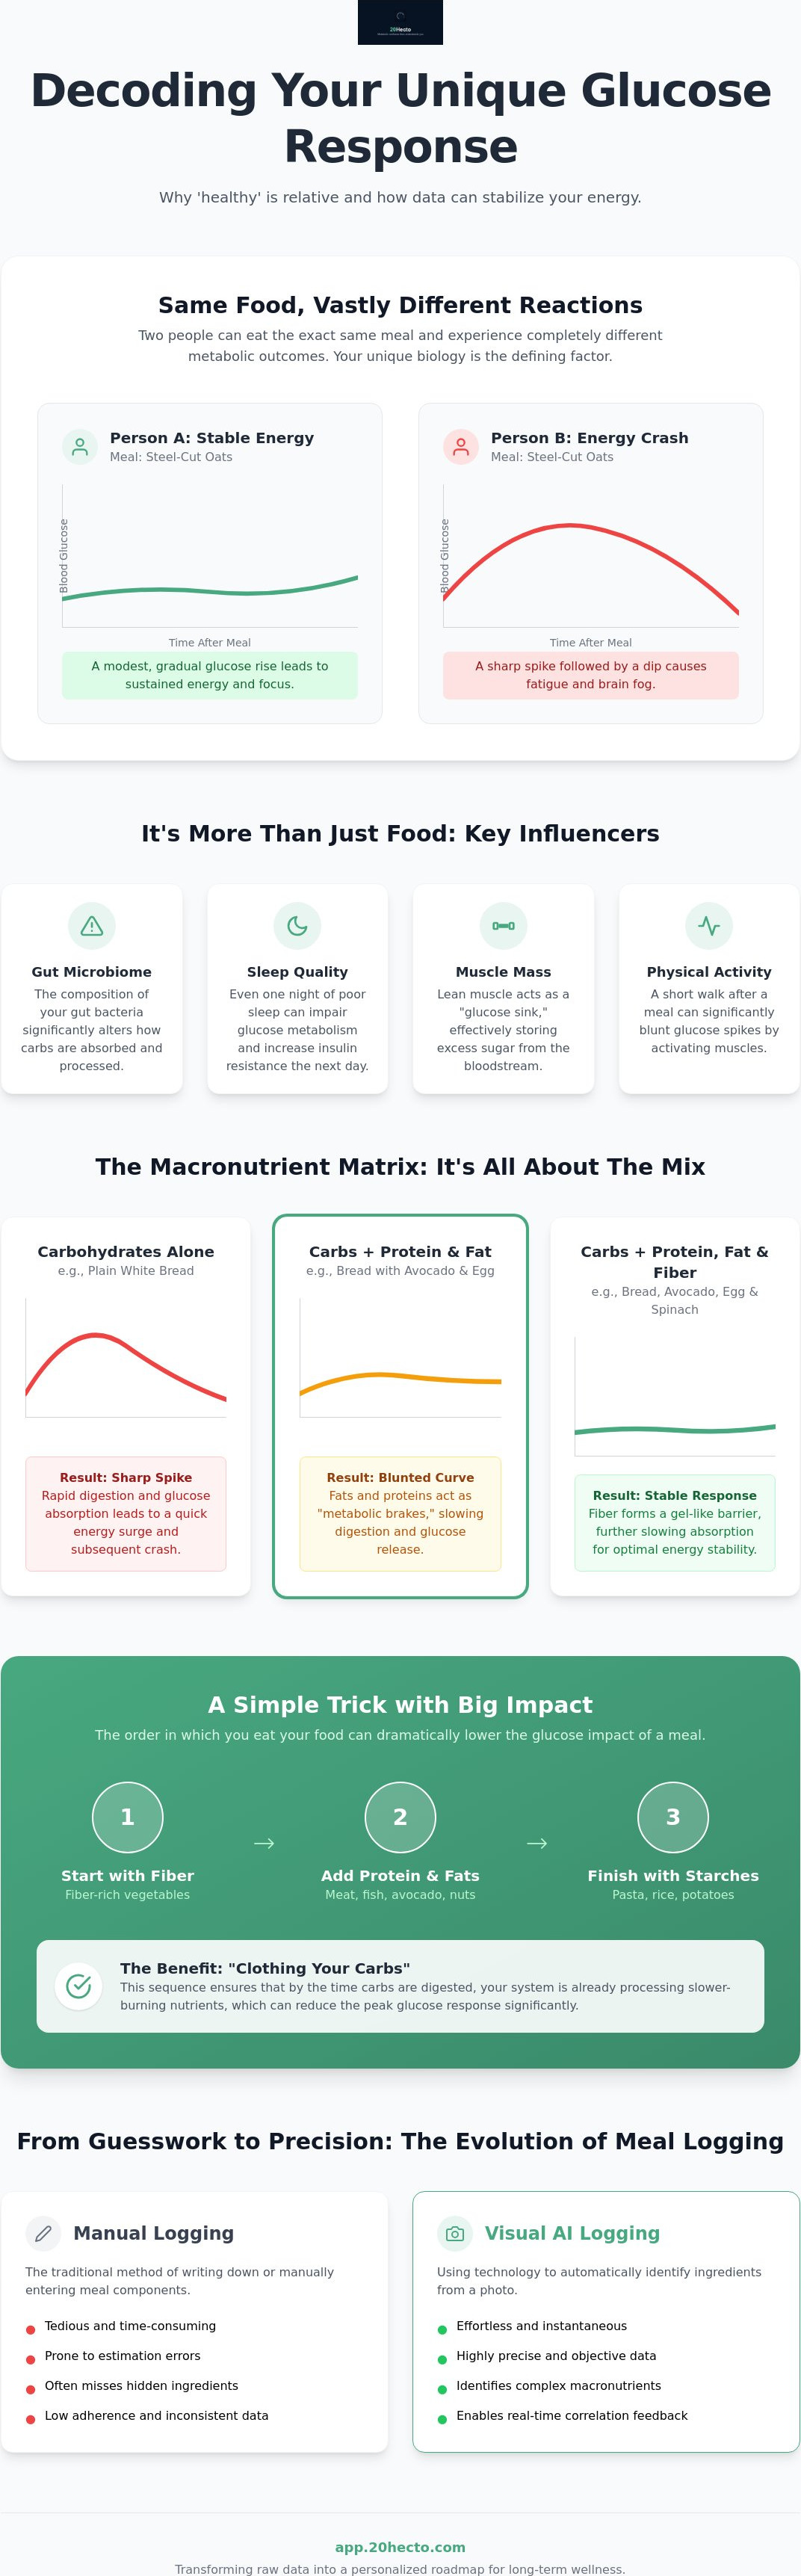
The nutritional correlation with blood sugar describes the direct, measurable relationship between specific food intake and the resulting fluctuations in your glucose levels. Every time you eat, your body initiates a complex sequence of nutrient absorption, hormonal signaling, and energy distribution. This process results in a postprandial (after-meal) glucose curve. While traditional nutrition often relies on static charts, modern data shows that these curves are highly individualized. Two people can consume the exact same banana and experience vastly different metabolic outcomes. One might see a modest rise, while the other experiences a significant spike followed by an energy-crushing dip.
These variations occur because your body isn't a simple calculator. It's a dynamic system influenced by several secondary factors. Your gut microbiome, for instance, plays a critical role in how carbohydrates are fermented and absorbed. Research increasingly shows that the specific composition of your gut bacteria can predict your glucose response better than the calorie count alone. Similarly, sleep deprivation can impair glucose metabolism overnight. A single night of poor rest reduces your ability to process carbohydrates effectively the next day, altering your typical metabolic patterns. Understanding these nuances helps shift the focus from short-term spikes to long-term health markers like HbA1c and lipid profiles.
The Role of Insulin Sensitivity
Insulin sensitivity refers to how effectively your cells respond to insulin to take up glucose from the bloodstream. When sensitivity is high, your body requires less insulin to manage a meal. Muscle mass acts as a primary glucose sink; higher levels of lean muscle generally improve your nutritional correlation with blood sugar by providing more storage space for circulating glucose. Physical activity levels also shift this correlation. A 15 minute walk after eating can significantly blunt a glucose spike by activating non-insulin-dependent glucose uptake in the muscles. Metabolic flexibility is the body's ability to switch between fuel sources like fats and carbohydrates based on availability and demand.
Personalized Glycaemic Responses (PGR)
Landmark nutritional studies have confirmed that individual responses to food are so varied that population-wide averages are often unhelpful. This is why the glycemic index (GI) can be misleading. The GI ranks foods based on how they affect a "typical" person, but it fails to account for your specific genetic makeup or metabolic health. Genetic factors influence everything from how quickly you produce saliva enzymes to the speed of glucose clearance from your blood. By tracking your own data, you move beyond generic advice and begin to identify the specific "metabolic triggers" that are unique to your biology.
Beyond Carbs: Decoding the Nutritional Matrix
Understanding the nutritional correlation with blood sugar requires looking past simple carbohydrate counts. While Carbohydrates and Blood Sugar are fundamentally linked, the presence of lipids and amino acids significantly alters the speed of glucose entry into the bloodstream. Fats and proteins act as metabolic brakes. They slow down gastric emptying, which prevents the rapid dumping of sugar into the small intestine. This blunting effect explains why a plain piece of white bread causes a sharp spike, but the same bread paired with avocado and an egg produces a significantly flatter curve.
Fiber acts as a critical metabolic buffer. Viscous fibers, found in legumes and non-starchy vegetables, form a gel-like substance in the digestive tract. This physical barrier interferes with enzyme access to starches, effectively lowering the meal's overall impact. Conversely, ultra-processed ingredients often contain hidden sugars and lack cellular structure. These foods bypass natural digestive slowing, which disrupts the expected nutritional correlation with blood sugar and leads to unpredictable results. This lack of structural integrity is why liquid calories often cause much higher spikes than their whole-food counterparts.
The Power of Food Sequencing
Changing the order of your food intake is an efficient way to manage glucose without restricting calories. Start with fiber-rich vegetables, move to proteins and fats, and finish with starches. This strategy, often called "clothing your carbs," ensures that by the time glucose hits your system, the digestive tract is already occupied with slower-burning nutrients. A simple adjustment, like eating a side salad before a pasta dish, can reduce the peak glucose response by nearly 75 percent in some individuals. Practical adjustments include:
- Eat a handful of nuts before a fruit snack.
- Start every dinner with a bowl of leafy greens.
- Add a tablespoon of olive oil or vinegar to starch-heavy meals.
Glycaemic Load vs. Glycaemic Index
The Glycaemic Index (GI) provides a snapshot of how quickly a food raises blood sugar, but it doesn't account for how much of that food you actually eat. Glycaemic Load (GL) is a more accurate predictor because it factors in portion size. For example, watermelon has a high GI but a very low GL because it is mostly water; you would have to eat an impractical amount to see a significant spike. In contrast, a large bowl of pasta has both a high GI and a high GL. Portion size remains the primary lever for controlling your metabolic response. Tracking these variables manually is complex, which is why many users prefer to monitor their glycaemic load through automated tools.
The Technology of Correlation: Manual vs. AI Logging
Manual data entry creates a significant friction point in metabolic tracking. Traditional food diaries require users to estimate weights, search databases, and manually enter values, which often leads to logging fatigue. This fatigue results in missing data points during critical glucose fluctuations. Visual AI logging eliminates this barrier by using computer vision to identify meal components from a single photograph. By automating the identification of ingredients, technology provides a more consistent and objective record of your intake than any manual diary could offer.
This digital approach enables a precise nutritional correlation with blood sugar by aligning meal timestamps with Continuous Glucose Monitor (CGM) data. When you capture a photo, the system records the exact time of ingestion. It then overlays this data onto your glucose curve, allowing you to see the immediate metabolic impact of specific ingredients. This real-time synchronization moves beyond general knowledge of how carbohydrates affect blood sugar and provides a personalized view of your body's response. Barcode scanning further refines this analysis by flagging metabolic disruptors like emulsifiers or hidden sweeteners in packaged foods that might otherwise go unnoticed.
The Accuracy Gap in Nutritional Data
Manual diaries are notorious for underreporting. Users frequently forget to log "invisible" variables like cooking oils, salad dressings, or small snacks. AI identifies these hidden components by analyzing the visual properties of the meal. This precision is vital for uncovering the nutritional correlation with blood sugar for complex, multi-ingredient dishes. Granular data allows you to distinguish between a spike caused by the starch in a meal and a spike exacerbated by a hidden sugar in the sauce. This level of detail is essential for identifying your specific trigger foods.
Visual Evidence and Metabolic Awareness
Seeing a meal photo side by side with a glucose graph creates a powerful psychological feedback loop. It transforms abstract numbers into concrete visual evidence. Users can quickly recognize how portion sizes or specific food combinations correlate with their energy levels and glucose stability. This visual context helps users recognize portion size issues that a simple text entry might obscure. AI meal logging reduces the time to insight for metabolic tracking by providing instant analysis without the need for manual calculation.
5 Steps to Map Your Personal Nutritional Correlation
Mapping your unique nutritional correlation with blood sugar requires a systematic approach. You can't rely on generic glycemic charts because they don't account for your specific insulin sensitivity or gut microbiome. By following a structured five-step protocol, you transform subjective feelings into objective data. This process allows you to identify exactly which foods fuel your performance and which ones hinder it.
First, establish a baseline by tracking three days of normal eating without intervention. Don't change your habits yet; simply observe. Second, use visual logging to capture exact meal compositions and timestamps. A photo provides a more accurate record of portion sizes and hidden ingredients than a text entry. Third, monitor the two-hour postprandial window. This period is critical for identifying peak glucose responses. Fourth, analyze your data to find patterns. Look for consistent "spikers" versus "stable" meals. Finally, iterate. Modify one variable, such as adding fiber or changing the food order, and re-test the same meal to see the difference.
Identifying Your Personal Trigger Foods
Many users discover hidden spikes from foods typically considered healthy. Oatmeal, grapes, or brown rice can cause significant glucose excursions for some individuals while remaining stable for others. It's also vital to track external variables like stress and caffeine. High cortisol levels can amplify your nutritional correlation with blood sugar, making a meal seem more "spiky" than it truly is. Utilizing an AI nutrition coach like Nuti helps interpret these complex data patterns, providing clarity when your responses seem contradictory.
Refining Your Metabolic Dashboard
Your specific goals dictate your target glucose ranges. Someone focused on longevity might aim for a tighter range than someone focused on immediate weight loss. Integrating intermittent fasting data into your dashboard also provides insights into how your body handles stored energy. This data helps you understand how fasted states enhance your insulin sensitivity over time. Learn how visual meal logging improves glucose tracking to ensure your data is as accurate as possible. To begin mapping your responses today, access your metabolic wellness dashboard and start your baseline tracking.
Optimizing Metabolic Health with 20Hecto AI Insights
Achieving peak metabolic health requires moving beyond isolated data points. The 20Hecto platform solves the problem of fragmented information by integrating AI meal photo logging directly into a comprehensive Metabolic Wellness Dashboard. This unified environment allows you to see the immediate nutritional correlation with blood sugar alongside long-term health trends. Instead of juggling multiple apps for food, glucose, and lab results, you gain a single, objective view of your metabolic status. This integration removes the friction of manual analysis and provides a clear path to data-driven health optimization.
Data transparency is equally vital for clinical collaboration. The platform includes practitioner data sharing capabilities, which transform your daily logs into a professional tool for your healthcare provider. When your doctor can see exactly how your meal choices correlate with your glucose curves, they can provide more precise guidance. This partnership moves your care away from generic recommendations and toward a strategy based on your actual biological responses. It ensures that every stakeholder in your health journey has access to the same high-fidelity data.
Nuti: Your 24/7 AI Metabolic Companion
Nuti, the AI nutrition coach, provides the real-time feedback necessary to stay on track. By analyzing a single photo, Nuti identifies the glycaemic load and nutritional density of your meal. You don't have to wait for a weekly review to understand your choices. Nuti offers instant insights, helping you recognize patterns as they happen. If a specific meal has historically caused a spike, the AI coach suggests intelligent swaps based on your own metabolic history. This proactive guidance helps you refine your nutritional correlation with blood sugar without the need for constant manual calculation.
Longitudinal Tracking: From Meals to Lab Results
Daily glucose fluctuations provide immediate feedback, but they're only one component of metabolic health. 20Hecto connects these daily habits to longitudinal markers by tracking lab values like HbA1c, thyroid function, and lipid panels. This approach allows you to see the "big picture" of how your nutrition influences your systemic health over months and years. You can finally observe how stabilizing your postprandial glucose leads to measurable improvements in your long-term blood markers. It's a comprehensive system designed for those who value scientific accuracy and efficiency. Start mapping your nutritional correlation today with 20Hecto to take full control of your metabolic data.
Take Command of Your Metabolic Future
Understanding your unique nutritional correlation with blood sugar is the first step toward sustained energy and long-term health. You've seen how personalized biology dictates glucose responses and why generic dietary advice often falls short. By moving beyond manual logs and embracing data-driven precision, you eliminate the guesswork that leads to metabolic frustration. The transition from reactive tracking to proactive optimization is now possible through advanced technology.
Leveraging AI-powered meal photo recognition and an integrated metabolic wellness dashboard allows you to map your responses with clinical accuracy. Direct practitioner data sharing further ensures that your health journey is supported by objective evidence rather than estimates. This comprehensive approach provides the clarity needed to make informed decisions every time you eat. It's time to transform your raw data into a roadmap for peak performance and metabolic stability.
Ready to see how your body actually responds to your favorite meals? Start your metabolic optimization journey with 20Hecto today. Your data is the most powerful tool you have for a healthier, more informed life.
Frequently Asked Questions
What is the most important nutrient for blood sugar correlation?
Carbohydrates are the primary nutrient influencing your nutritional correlation with blood sugar because they break down directly into glucose during digestion. However, the presence of fiber, fats, and proteins determines the overall speed and magnitude of this response. A high-fiber meal creates a slower, more stable curve than refined sugars, which enter the bloodstream almost immediately.
How long after eating should I check my blood sugar for accurate correlation?
You should check your blood sugar between 60 and 120 minutes after finishing a meal to capture the peak postprandial response. This window provides the most accurate data for mapping your individual metabolic trends. Monitoring at the two-hour mark specifically helps identify how efficiently your body clears glucose from the bloodstream and returns to its baseline level.
Can AI really identify the nutritional content of a photo?
Yes, advanced computer vision models identify individual ingredients and estimate portion sizes from a single photograph. These systems analyze visual properties like texture, color, and volume to calculate the nutritional density and glycaemic load of a meal. This technology removes the friction and errors associated with manual database searches and subjective weight estimations.
Why does the same meal cause different blood sugar responses on different days?
Variations occur due to secondary metabolic factors like sleep quality, stress levels, and recent physical activity. A single night of poor rest can significantly alter the nutritional correlation with blood sugar by increasing insulin resistance the following day. Your gut microbiome's current state and your hydration levels also influence how effectively you process specific nutrients.
What is a 'normal' blood sugar spike after a meal in 2026?
The 2026 American Diabetes Association Standards of Care emphasize staying within a "time in range" of 70 to 180 mg/dL for most adults. While individual targets vary based on health status, a healthy postprandial spike typically stays below 140 mg/dL for individuals without metabolic disorders. Maintaining this range is a key metric for sustained energy and long-term wellness.
How does glycaemic load differ from glycaemic index?
The Glycaemic Index measures how quickly a carbohydrate raises blood sugar, while Glycaemic Load accounts for the actual quantity of carbohydrates in a standard serving. Glycaemic Load is a more reliable predictor of your body's real-world response. For example, a food might have a high index but a low load if the serving size contains very few total carbohydrates.
Is visual meal logging more accurate than manual calorie counting?
Visual meal logging is generally more accurate because it captures "forgotten" variables like cooking oils, dressings, and garnishes. Manual counting relies on user memory and subjective portion estimation, which often leads to significant underreporting. Photo-based logging provides an objective, timestamped record that aligns perfectly with glucose sensor data for precise metabolic analysis.
Can I share my metabolic health data with my doctor through an app?
Yes, you can use practitioner data sharing to send your metabolic dashboard directly to your healthcare provider for review. This feature allows your doctor to see your meal photos alongside your glucose trends and long-term lab values like HbA1c. Shared data transforms your clinical visits from general discussions into precise, data-driven consultations based on your actual lifestyle.